Uptime Kuma: Know When Things Break Before Anyone Tells You
Here’s a question that changed how I think about my homelab: if Pi-hole goes down at 2am, how would you know?
Not how would you fix it — how would you even know it happened? You’d wake up, your family would complain that the internet was “slow” (because ads were loading again), you’d SSH in, realise the container had crashed six hours ago, restart it, and carry on. No idea what caused it. No idea how long it was down. No data to prevent it happening again.
That gap — between running services and actually knowing what your services are doing — is the gap between a hobbyist and an operator. Monitoring is what bridges it. And Uptime Kuma is the best way to start.
Career Context: Monitoring and observability are non-negotiable in enterprise environments. Every SRE, DevOps, and Platform Engineering role involves monitoring. Understanding how to set up monitors, configure meaningful alerts, manage alert fatigue, and build status pages maps directly to tools like Datadog, PagerDuty, Grafana, and New Relic. The concepts are identical — only the scale differs. SRE roles paying £55-80k+ expect this as baseline knowledge.
Why Monitoring Matters More Than You Think
Most homelab guides treat monitoring as an afterthought. They’ll walk you through deploying 15 containers and then casually mention “you might want to add monitoring at some point.” That’s backwards. In every enterprise I’ve worked with, monitoring is deployed before the services it watches, or at worst alongside them.
There’s a reason for that. Without monitoring, you’re operating blind. You don’t know:
- Whether services are actually responding (a running container isn’t necessarily a working container)
- How long outages last (was it 30 seconds or 3 hours?)
- Whether response times are degrading before a full outage
- Whether problems correlate with other events (does Nextcloud slow down every time a backup runs?)
- What your actual uptime is — not what you assume, what the data shows
I run Uptime Kuma on my homelab and I check it most mornings. Not obsessively — just a quick glance at the dashboard while the kettle’s boiling. That habit alone has caught slow DNS resolution, containers that silently restarted overnight, and a near-full disk before it caused real problems. Each of those would have become a much bigger issue if I’d found out about them the hard way.
That’s what monitoring gives you: time. Time to fix things before they become emergencies.
What Uptime Kuma Actually Is
Uptime Kuma is a self-hosted monitoring tool created by Louis Lam. Think of it as a self-hosted alternative to services like UptimeRobot, Pingdom, or StatusCake — except you own the data, there’s no monthly fee, and it runs happily on a Raspberry Pi.
It gives you:
- Multiple monitor types: HTTP(S), TCP, Ping, DNS, Docker container, and more
- Notification channels: Telegram, Discord, Slack, email, webhooks, and 90+ others
- Status pages: Public or private pages showing service health
- Uptime history: Charts showing availability over time
- Certificate monitoring: Alerts before SSL certificates expire
- A genuinely good UI: Clean, responsive, fast — rare for self-hosted tools
It’s a single Docker container, uses SQLite for storage (no database server needed), and consumes minimal resources. On a Pi 5, it barely registers on the resource meters.
Installation
This assumes you’ve got Docker running on your Pi 5. If not, start with Article 1: Docker in this series.
Option 1: Docker Run (Quick Start)
docker run -d \
  --name uptime-kuma \
  --restart=always \
  -p 3001:3001 \
  -v uptime-kuma-data:/app/data \
  louislam/uptime-kuma:1
That’s it. Visit http://your-pi-ip:3001 and you’ll see the setup screen.
Option 2: Docker Compose (Recommended)
If you’re following this series, you should be using Compose files by now. Create a directory and a compose file:
mkdir -p ~/docker/uptime-kuma
cd ~/docker/uptime-kuma
Create docker-compose.yml:
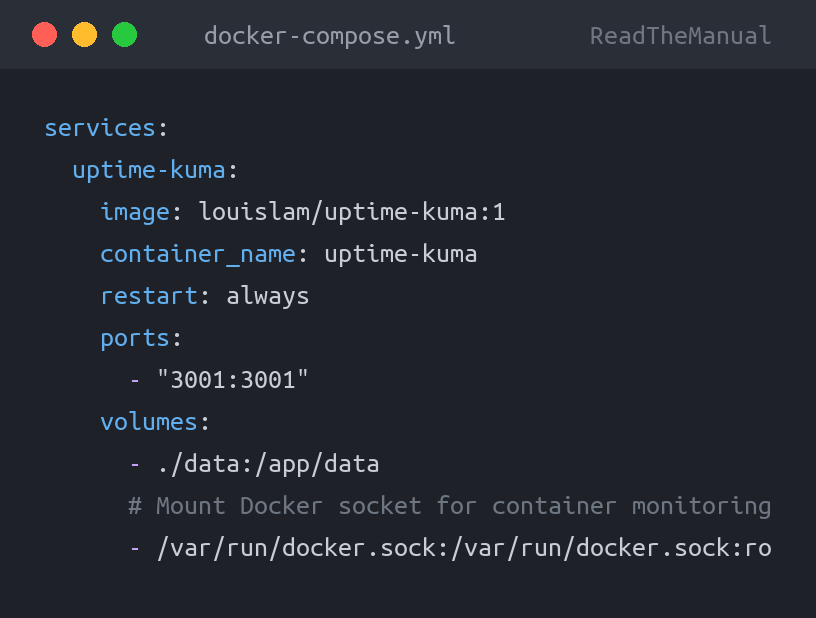
services:
  uptime-kuma:
    image: louislam/uptime-kuma:1
    container_name: uptime-kuma
    restart: always
    ports:
      - "3001:3001"
    volumes:
      - ./data:/app/data
      # Mount Docker socket for container monitoring
      - /var/run/docker.sock:/var/run/docker.sock:ro
docker compose up -dPro tip: Notice the Docker socket mount (/var/run/docker.sock). This lets Uptime Kuma monitor your Docker containers directly — not just whether a port is open, but whether the container process itself is running. The :ro makes it read-only, which is a sensible security practice. Uptime Kuma only needs to read container state, not control them.
First-Time Setup
Open http://your-pi-ip:3001 in your browser. You’ll be asked to create an admin account. Use a strong password — if you expose this to the internet later (via your reverse proxy from Article 4), you don’t want a weak password on your monitoring dashboard.
Once logged in, you’ll see an empty dashboard. It looks a bit lonely. Let’s fix that.
Setting Up Your First Monitors
Click “Add New Monitor” and you’ll see the monitor type dropdown. Here’s what each useful type does and when to use it.
HTTP(S) Monitor
The bread and butter. This hits a URL and checks the response.
- URL: The full URL to check (e.g.,
http://192.168.1.50:8080for a local service, orhttps://yourdomain.comfor external) - Heartbeat Interval: How often to check. 60 seconds is sensible for most homelab services.
- Retries: How many failures before alerting. Set this to 2 or 3 — a single failed check might just be a network blip.
- Accepted Status Codes: Usually 200-299. Some services return 301/302 redirects, so you might need to adjust.
Start with these HTTP monitors:
- Pi-hole admin panel —
http://localhost:80/admin(or whatever port you’ve mapped) - Portainer —
https://localhost:9443 - Any other web UIs you’re running
TCP Monitor
Checks whether a port is open and accepting connections. Use this for services that don’t have a web interface.
- Pi-hole DNS — Host:
localhost, Port:53. This checks that DNS is actually responding, not just that the web UI is up. A crucial distinction — the admin panel can be working fine while DNS resolution is broken. - SSH — Port
22. Useful if you want to know your remote access is available. - Any database ports you’re running (PostgreSQL on 5432, Redis on 6379, etc.)
Ping Monitor
Simple ICMP ping. Good for checking if a host is reachable at all.
- Your router — ping
192.168.1.1. If this goes down, you know the problem is network-level, not service-level. - Other machines on your network — if you’ve got other Pis, NAS boxes, or servers, ping monitors give you basic up/down visibility.
- An external target — ping
1.1.1.1or8.8.8.8. If this goes down but everything else is up, your internet connection has dropped.
Docker Container Monitor
This is where that socket mount pays off. Instead of checking ports, this checks whether a Docker container is actually in a “running” state.
- Container Name/ID: Select from the dropdown (populated from the Docker socket)
- Use this alongside HTTP monitors. A container can be “running” but unresponsive (stuck process, out-of-memory kill pending), and an HTTP endpoint can be healthy while the container is in a restart loop. Both monitors together give you proper coverage.
DNS Monitor
Resolves a hostname and checks the result. Brilliant for validating that your DNS infrastructure (Pi-hole, local DNS) is working correctly.
- Hostname: e.g.,
google.com - DNS Server: Your Pi-hole’s IP
- This catches Pi-hole failures that a simple ping wouldn’t detect.
Common gotcha: If you’re monitoring services on the same Pi that runs Uptime Kuma, use localhost or 127.0.0.1 carefully. Inside a Docker container, localhost refers to the container itself, not the host. Use your Pi’s actual LAN IP (e.g., 192.168.1.50) or the Docker bridge network gateway (172.17.0.1) to reach services on the host from within the Uptime Kuma container. The Docker container monitor bypasses this issue entirely because it reads the socket directly.
Notification Channels: Getting Alerted When It Matters
Monitors are useless without notifications. If Uptime Kuma detects a failure but nobody sees it, you’re back to finding out when someone complains about the internet.
Go to Settings (gear icon) → Notifications to configure your channels.
Telegram (Easiest, Recommended First)
Telegram is the simplest notification channel to set up and the most reliable for personal use. Here’s the setup:
- Create a Telegram bot: Message
@BotFatheron Telegram, send/newbot, follow the prompts. You’ll get an API token. - Get your Chat ID: Message
@userinfoboton Telegram. It’ll reply with your numeric chat ID. - In Uptime Kuma: Add notification → Telegram. Paste your bot token and chat ID. Send a test notification to verify.
# What you need from Telegram:
Bot Token: 123456789:ABCdefGHIjklMNOpqrSTUvwxyz  (from @BotFather)
Chat ID:   987654321                               (from @userinfobot)

# That's it. Two values, and you have push notifications on your phone.
The entire process takes about two minutes. Once configured, you’ll get push notifications on your phone whenever a service goes down or comes back up. It’s genuinely satisfying the first time your phone buzzes to tell you a container restarted, and you can fix it from the sofa before anyone in the house even notices.
Discord
If you already use Discord, create a webhook in a private server channel (Channel Settings → Integrations → Webhooks). Paste the webhook URL into Uptime Kuma. Messages arrive as embedded cards with status colour coding.
Email (SMTP)
Requires an SMTP server. You can use a Gmail app password, but honestly Telegram is faster to set up and more reliable for instant alerts. Email tends to get buried. If you need email for compliance or business reasons, configure it, but don’t rely on it as your only channel.
Webhooks
The power option. Uptime Kuma can send JSON payloads to any URL when status changes. This is how you connect it to other systems — trigger an n8n workflow (Article 9) to attempt automatic recovery, log incidents to a database, or post to a team channel.
// Example webhook payload from Uptime Kuma
{
  "heartbeat": {
    "monitorID": 1,
    "status": 0,
    "time": "2026-02-18 02:14:00",
    "msg": "Connection refused",
    "ping": null
  },
  "monitor": {
    "name": "Pi-hole DNS",
    "url": "192.168.1.50",
    "type": "port",
    "port": 53
  }
}
Pro tip: Set up at least two notification channels. Telegram for instant mobile alerts, plus Discord or email as a backup. If your Telegram bot ever has issues (rare, but it happens), you want a fallback. Redundant alerting is a fundamental principle in enterprise monitoring — start practising it here.
Status Pages: Your Operational Dashboard
Uptime Kuma lets you create status pages — clean, public-facing (or private) pages that show the health of your services. This is the same concept as status.github.com or AWS Service Health Dashboard.
Go to “Status Pages” in the sidebar, click “New Status Page,” and give it a name and slug.
Organising Your Status Page
Group your monitors logically:
- Network Infrastructure: Pi-hole DNS, Router Ping, Internet Connectivity
- Core Services: Portainer, Nginx Proxy Manager, Gitea
- Applications: Nextcloud, Home Assistant, Jellyfin
- External: Any external sites or APIs you depend on
You can create multiple status pages. A common pattern is:
- Private/Internal page: Everything, including infrastructure details. For your eyes only.
- Public page: Just the services others use (family Nextcloud, Jellyfin, etc.), without exposing internal infrastructure details.
Status pages can be password-protected, or completely public. If you’re running services that family members use, a simple status page at status.yourdomain.com saves you from “is the internet broken?” messages. They can check for themselves.
Alert Fatigue: The Silent Killer of Monitoring
Here’s something every enterprise SRE learns the hard way, and you might as well learn it on your homelab where the stakes are lower: alert fatigue is real, and it will make you ignore your monitoring entirely if you don’t manage it.
Alert fatigue happens when you get too many notifications. Your phone buzzes constantly with minor blips, transient network issues, or services that restart quickly enough to not actually matter. Within a week, you start ignoring the notifications. Within two weeks, you’ve muted the channel. Within a month, you might as well not have monitoring at all.
How to Prevent It
- Set retries to 3-5. A single failed health check is noise. Three consecutive failures is a pattern worth investigating. This alone eliminates most false positives.
- Use sensible intervals. Checking every 10 seconds is unnecessary for a homelab. Every 60 seconds is fine for most services. Every 300 seconds (5 minutes) is adequate for anything non-critical.
- Distinguish severity. Not every service needs an instant push notification. Pi-hole going down? Alert immediately — everyone on the network is affected. A personal wiki going down? That can wait until you check the dashboard in the morning.
- Use Uptime Kuma’s “Maintenance” feature. Before doing planned work (updates, reboots, config changes), set a maintenance window. This suppresses alerts during the window so you’re not drowning in expected notifications.
- Review and prune. If a monitor alerts weekly and you always decide it’s not worth acting on, either fix the underlying issue, adjust the thresholds, or remove the monitor. A monitor you always ignore is worse than no monitor — it trains you to ignore alerts.
In enterprise environments, there’s a concept called “alert hygiene.” Teams regularly review their alert configurations, remove noisy alerts, and ensure every alert that fires is actionable. Start building that discipline now. An Uptime Kuma dashboard with 15 well-tuned monitors is infinitely more useful than one with 50 monitors that fire constantly.
The biggest monitoring gotcha: You’re monitoring from the same machine you’re monitoring. If the Pi itself goes down — power failure, kernel panic, SD card corruption — Uptime Kuma goes down with it, and you get no alerts about anything. This is a fundamental limitation. Enterprise environments solve it with distributed monitoring (multiple vantage points). For a homelab, the pragmatic solutions are: (1) use a free external monitor like UptimeRobot to watch one endpoint on your Pi, giving you an outside-in view, or (2) if you have a second Pi or any other machine, run a second Uptime Kuma instance there watching the first. Even monitoring your Pi’s Uptime Kuma instance from a free cloud service gives you that critical external perspective.
Building Operational Instincts
Here’s what nobody tells you about monitoring: the dashboard is only half the value. The other half is the instincts you develop by looking at it regularly.
After a few weeks of checking Uptime Kuma, you’ll start noticing patterns:
- “Response times on Nextcloud spike every night at 2am” — that’s your backup job competing for disk I/O.
- “Pi-hole had three brief outages last Tuesday” — that was the day you ran
apt upgradeand Docker restarted. - “Everything had a blip at 4:17am on Saturday” — your ISP had a brief outage. The internet ping monitor confirms it.
- “Gitea’s response time has been gradually increasing over two weeks” — the disk is filling up and needs attention.
These pattern-recognition skills are exactly what separates a good SRE from a great one. Anyone can respond to an alert that says “service down.” The valuable skill is looking at trends and saying “this is going to be a problem next week if we don’t act now.” Capacity planning, trend analysis, correlation — these are senior-level skills, and they start with the simple habit of checking a dashboard.
A Morning Routine That Builds Skills
Adopt this habit: every morning, spend 60 seconds on your Uptime Kuma dashboard before you check email or social media. Just glance at it.
- Is everything green? Good. Move on.
- Something yellow or red? Investigate.
- Any response time changes? Note them.
- Any overnight events in the history? Understand why.
This is literally what operations teams do in enterprise environments. The morning “service review” or “ops handover” is a standard practice. You’re building the same muscle memory, just on a smaller scale.
Advanced Configuration
Monitor Groups and Tags
As your monitoring grows, organisation matters. Use Uptime Kuma’s tag system to categorise monitors:
- Tags by type:
infrastructure,application,external - Tags by priority:
critical,important,informational - Tags by host:
pi5-main,pi4-newsletter,nas
This mirrors how enterprise monitoring is structured. In Datadog or Grafana, you’d use labels and tags to filter dashboards and route alerts. Same concept, smaller scale.
SSL Certificate Monitoring
If you’ve set up Nginx Proxy Manager (Article 4) with Let’s Encrypt certificates, add HTTPS monitors for your public-facing services. Uptime Kuma will automatically track certificate expiry and warn you before they lapse.
Set the certificate expiry warning to 14 days. Let’s Encrypt certificates last 90 days and auto-renew at 30 days, but renewals can fail silently. A 14-day warning gives you time to investigate and fix before your sites start showing certificate errors.
Keyword Monitoring
HTTP monitors can check for specific content on the page, not just a 200 status code. This catches scenarios where a service returns 200 OK but the actual content is an error page.
# Example: Monitor Pi-hole is actually working, not just responding
URL: http://192.168.1.50/admin
Expected keyword: "Total Queries"

# If Pi-hole's database is corrupted, the admin page might load
# but show an error instead of query stats. Keyword monitoring catches this.
A Real Monitoring Setup
Here’s what my actual Uptime Kuma instance monitors. This should give you a practical starting point:
# Network Infrastructure
- Router Ping          | Ping   | 192.168.1.1          | 60s interval
- Internet (Cloudflare)| Ping   | 1.1.1.1              | 60s interval
- Pi-hole DNS          | DNS    | google.com via Pi     | 60s interval

# Core Services (this Pi)
- Pi-hole Admin        | HTTP   | http://192.168.1.50/admin | 60s  | keyword: "Total Queries"
- Portainer            | HTTP   | https://192.168.1.50:9443 | 120s
- Nginx Proxy Manager  | HTTP   | http://192.168.1.50:81    | 120s

# Docker Containers
- pihole container     | Docker | pihole                | 60s
- portainer container  | Docker | portainer             | 120s
- uptime-kuma container| Docker | uptime-kuma           | 120s

# Other machines
- NAS                  | Ping   | 192.168.1.100         | 300s
- Second Pi            | Ping   | 192.168.1.134         | 300s

# External (if applicable)
- Blog                 | HTTP   | https://readthemanual.tech | 300s
- Gitea                | HTTP   | https://git.yourdomain.com | 300s
Notice the different intervals. Critical infrastructure (DNS, router) gets checked every 60 seconds. Less critical services get 120 seconds. External services and other machines get 300 seconds. This keeps the monitoring load light while ensuring you know about critical issues quickly.
Gotchas and Troubleshooting
Container Networking
The most common issue people hit: monitors using localhost can’t reach services on the host because Docker containers have their own network namespace. Use your Pi’s LAN IP address instead, or use Docker’s host network gateway.
# Find your Docker bridge gateway (usually 172.17.0.1)
docker network inspect bridge | grep Gateway

# Use this IP to reach host services from within containers
# Or better yet, just use your Pi's LAN IP (e.g., 192.168.1.50)
Database Backups
Uptime Kuma stores everything in a SQLite database at /app/data/kuma.db. If you’re using the Compose file above with ./data mounted, this is on your host filesystem. Back it up. Losing your monitoring history is annoying; losing your carefully configured monitors and notification channels is infuriating.
# Simple backup (add to cron)
cp ~/docker/uptime-kuma/data/kuma.db ~/backups/kuma-$(date +%Y%m%d).db
Resource Usage
Uptime Kuma is lightweight, but on a Pi 5 with 8GB of RAM shared across many services, every megabyte matters. Typical usage is around 80-150MB of RAM and negligible CPU. If you’re monitoring 50+ endpoints, you might see slightly higher memory usage, but it would take hundreds of monitors to cause resource pressure on a Pi 5.
Updates
Uptime Kuma receives regular updates. To update with Docker Compose:
cd ~/docker/uptime-kuma
docker compose pull
docker compose up -d
Your data persists in the mounted volume, so updates are non-destructive. Still, take a backup before updating — it’s a good habit.
The Career Translation
Everything you’ve set up in this article maps directly to enterprise monitoring practices:
| Uptime Kuma Concept | Enterprise Equivalent |
|---|---|
| HTTP monitors | Synthetic monitoring (Datadog Synthetics, Pingdom) |
| TCP port checks | Infrastructure health checks (Nagios, Zabbix) |
| Docker container monitors | Container orchestration health (K8s liveness/readiness probes) |
| Notification channels | Incident alerting (PagerDuty, OpsGenie, VictorOps) |
| Status pages | Public status communication (Statuspage.io, Cachet) |
| Alert fatigue management | Alert hygiene, runbook development, on-call practices |
| Response time trending | SLI/SLO tracking, capacity planning |
| Morning dashboard check | Operations handover, service review meetings |
Interview Talking Points
Having run Uptime Kuma, you can credibly discuss:
- “How do you approach monitoring?” — You can talk about monitor types, check intervals, retry logic, and the difference between availability and functionality monitoring.
- “How do you handle alert fatigue?” — You’ve dealt with it. You know about thresholds, retries, severity levels, and maintenance windows.
- “What’s your experience with SLAs?” — You have actual uptime data. You know what 99.9% availability means in practice (8.7 hours of downtime per year) because you’ve watched your own numbers.
- “How do you handle incidents?” — You’ve been alerted at inconvenient times, triaged the issue, identified root cause from the monitoring data, and resolved it. That’s an incident response cycle.
- “Tell me about your monitoring stack.” — You’ve set up monitors, configured alerting, built status pages, and managed the system over time. The tools differ at enterprise scale; the process is identical.

What’s Next
You’ve now got monitoring in place — you know what your services are doing, you get alerts when things break, and you’re building the operational instincts that enterprise environments demand.
This sets you up perfectly for Article 8: K3s Kubernetes, where you’ll deploy a real Kubernetes cluster on your Pi. You’ll want monitoring already running when you start experimenting with Kubernetes, because pods will crash, deployments will fail, and you’ll want to see exactly what’s happening when they do.
Uptime Kuma also integrates beautifully with n8n (Article 9) via webhooks, letting you build automated responses to monitoring events — self-healing infrastructure that restarts failed services, scales resources, or escalates alerts based on severity.
Series navigation:
Running Uptime Kuma on your Pi? I’d be curious to know what you’re monitoring and how you’ve configured your alerts. The best monitoring setups are built iteratively — start simple, and refine as you learn what actually matters in your environment.

ReadTheManual is run, written and curated by Eric Lonsdale.
Eric has over 20 years of professional experience in IT infrastructure, cloud architecture, and cybersecurity, but started with PCs long before that.
He built his first machine from parts bought off tables at the local college campus, hoping they worked. He learned on BBC Micros and Atari units in the early 90s, and has built almost every PC he’s used between 1995 and now.
From helpdesk to infrastructure architect, Eric has worked across enterprise datacentres, Azure environments, and security operations. He’s managed teams, trained engineers, and spent two decades solving the problems this site teaches you to solve.
ReadTheManual exists because Eric believes the best way to learn IT is to build things, break things, and actually read the manual. Every guide on this site runs on infrastructure he owns and maintains.
Enjoyed this guide?
New articles on Linux, homelab, cloud, and automation every 2 days. No spam, unsubscribe anytime.