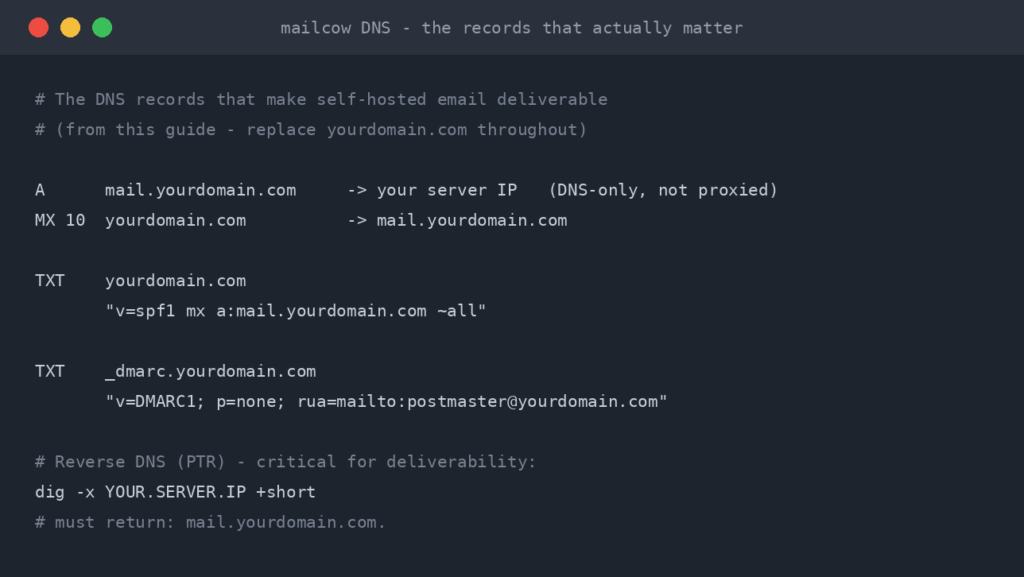
How to Install Uptime Kuma to Monitor Your Homelab (2026 Guide)
I monitor 30+ services across my homelab with Uptime Kuma. It has saved me from silent failures more times than I can count, and it takes about five minutes to deploy. Here is how to set it up properly.
From the homelab: Uptime Kuma monitors every service I run — over 30 endpoints across multiple hosts. It is the first thing I check when something feels off. Simple to set up, incredibly useful in practice.
Why You Need Monitoring (The 2am Story)
A few months back, my reverse proxy silently crashed at about 1am. Every service behind it, Nextcloud, Gitea, WikiJS, all of them, was technically running but completely unreachable from outside the network. I found out at 7am when I tried to push code from my laptop and Gitea wouldn’t respond.
Six hours of downtime. No alerts. No idea when it actually went down. No data to figure out why.
That was the morning I stopped treating monitoring as optional.
The thing is, most homelab guides get this backwards. They walk you through deploying 15 containers, then mention monitoring as an afterthought. In every enterprise environment I have worked in over the past 20 years, monitoring goes in first, or at absolute worst, alongside the services it watches. Your homelab deserves the same discipline.
Why Uptime Kuma Over the Alternatives
I have used Nagios, Zabbix, Grafana stacks, and commercial tools like Datadog and PagerDuty in production environments. They all have their place. But for a homelab, most of them are overkill or cost money you do not need to spend.
- Nagios/Zabbix – powerful but complex. Configuration file syntax that feels like it was designed to punish you. Fine for enterprise, unnecessary friction for a homelab.
- Grafana + Prometheus – brilliant for metrics and dashboards, but you are deploying and maintaining multiple services just to get basic uptime alerting. Great as a second layer, overkill as your only monitoring.
- UptimeRobot/Pingdom – hosted, which defeats the self-hosting philosophy. Free tiers are limited. You are handing your infrastructure topology to a third party.
- Uptime Kuma – single container, SQLite storage, beautiful UI, 90+ notification integrations, genuinely useful in under 10 minutes. It does one thing extremely well.
Uptime Kuma is not a replacement for a full observability stack. But it is the right starting point, and for many homelabs it is all you will ever need.
Prerequisites
You need two things:
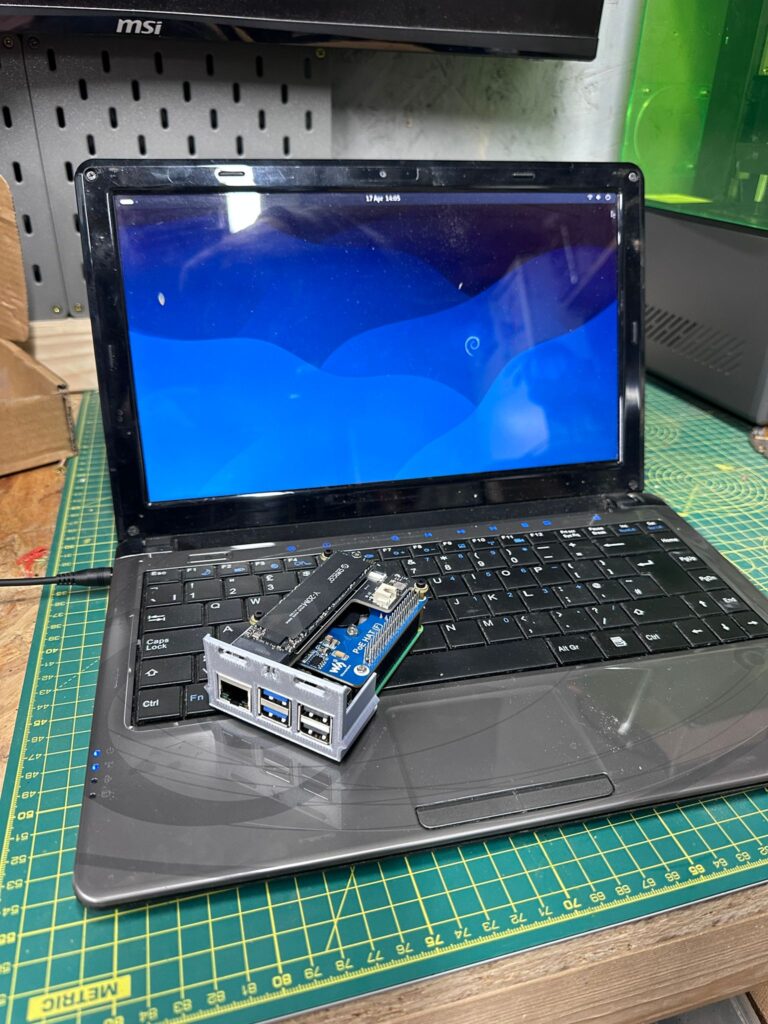
- A Linux host with Docker installed. Any Debian/Ubuntu machine, a Raspberry Pi, a mini PC, a VM, whatever you have. If you have not got Docker yet, follow my Docker installation guide first.
- A few minutes. Genuinely. This is one of the fastest services you will ever deploy.
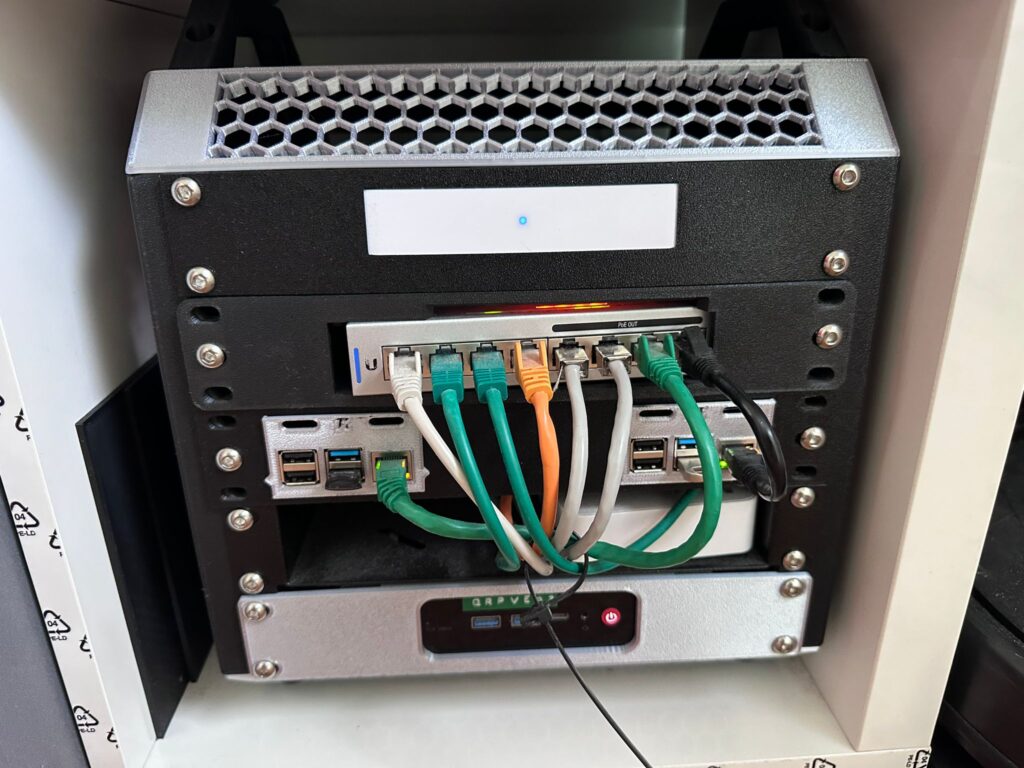
Uptime Kuma runs comfortably on minimal hardware. I have seen it run on a Raspberry Pi 3 without breaking a sweat. If you are running it on a Pi 5, it barely registers on the resource meters.
Step-by-Step Installation
Option 1: Docker Run (Quick Start)
If you just want it running now:
docker run -d \
  --name uptime-kuma \
  --restart=always \
  -p 3001:3001 \
  -v uptime-kuma-data:/app/data \
  louislam/uptime-kuma:1
That is it. Visit http://your-server-ip:3001 and you will see the setup screen.
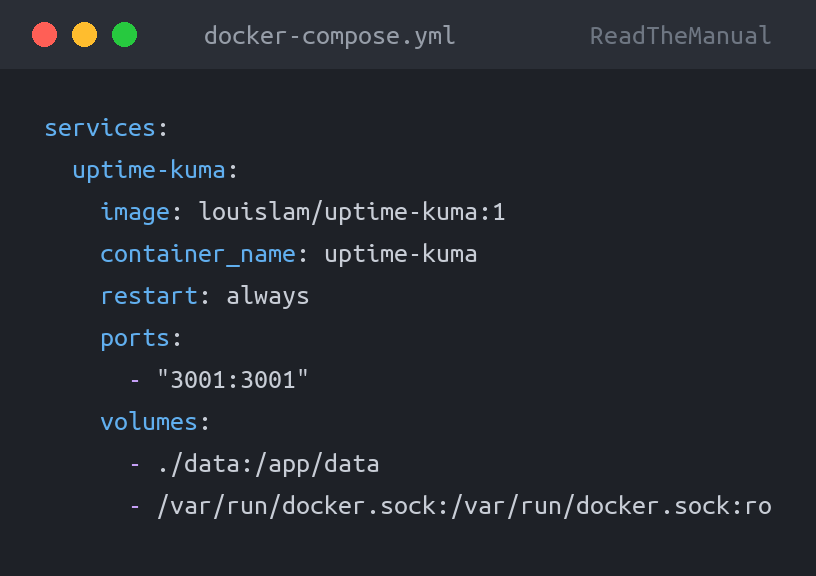
Option 2: Docker Compose (Recommended)
For anything beyond a quick test, use Compose. It is repeatable, version-controlled, and you will thank yourself when you need to rebuild or migrate.
mkdir -p ~/docker/uptime-kuma
cd ~/docker/uptime-kuma
Create a docker-compose.yml file:
services:
  uptime-kuma:
    image: louislam/uptime-kuma:1
    container_name: uptime-kuma
    restart: always
    ports:
      - "3001:3001"
    volumes:
      - ./data:/app/data
      - /var/run/docker.sock:/var/run/docker.sock:ro
Then bring it up:
docker compose up -dPro tip: That Docker socket mount (/var/run/docker.sock:ro) lets Uptime Kuma monitor your containers directly, not just whether a port responds, but whether the container process itself is running. The :ro flag makes it read-only. Uptime Kuma only needs to read container state, not control them. If you are security-conscious about socket access, you can skip this line and rely on HTTP/TCP monitors instead.
Verify It Is Running
docker ps | grep uptime-kumaYou should see the container running and port 3001 mapped. Open http://your-server-ip:3001 in your browser.
Initial Setup
On first visit, Uptime Kuma asks you to create an admin account. Pick a strong password. If you later put this behind a reverse proxy and expose it externally, you do not want a weak password on the dashboard that shows your entire infrastructure topology.
Once logged in, you will see an empty dashboard. Time to add your first monitor.
Click Add New Monitor. You will see a dropdown with monitor types: HTTP(S), TCP, Ping, DNS, Docker Container, and more. Start with an HTTP monitor pointed at something you care about, your reverse proxy landing page or a key service.
Set the Heartbeat Interval to 60 seconds. That is frequent enough to catch problems quickly without generating unnecessary load. Set Retries to 3, because a single failed check might just be a network blip, and you do not want false alarms training you to ignore alerts.
What to Monitor First
Do not try to monitor everything on day one. Start with the services that would actually cause you pain if they went down silently.
1. Your Reverse Proxy
If you are running Nginx Proxy Manager, Traefik, or Caddy, this is your single most critical service. If the proxy goes down, everything behind it is unreachable. Monitor the proxy’s own landing page or health endpoint with an HTTP check.
2. DNS Resolution
If you run Pi-hole, AdGuard Home, or any local DNS, add a DNS monitor. Point it at your DNS server and resolve a known domain. This catches the subtle failure where the web UI is up but DNS resolution itself has stopped working.
3. Your NAS or File Server
A Ping or TCP monitor on your NAS. If it drops offline overnight, you want to know before your backups fail silently for a week.
4. Key Self-Hosted Services
HTTP monitors on your most-used services. For me, that is Nextcloud, Gitea, and my wiki. Pick whichever ones would disrupt your day if they vanished. If you are running Vaultwarden as your password manager, that should be near the top of your monitoring list. Your household’s ability to log in to anything depends on it being available.
5. External Dependencies
An HTTP check on https://1.1.1.1 or https://dns.google. If this goes down but your internal services are fine, your internet connection has dropped. If everything goes down including this, it is a power or host-level problem. Having an external baseline makes troubleshooting faster.
6. SSL Certificate Expiry
Uptime Kuma automatically tracks SSL certificate expiry on any HTTPS monitor. It will warn you days before a certificate expires. I have seen production outages caused by expired certificates at multiple organisations. Let Uptime Kuma catch that for you at home so it never becomes a habit.
Career context: Knowing what to monitor, and why, is more valuable than knowing how to install the tool. In interviews for SRE, DevOps, or Platform Engineering roles, you will get asked about monitoring strategy. “I monitor the reverse proxy, DNS resolution, and key service endpoints with appropriate check types and retry thresholds” is a better answer than “I installed Grafana.” The thinking matters more than the tooling.
Setting Up Notifications
Monitoring without notifications is just a dashboard you will forget to check. The whole point is to be told when something breaks.
Go to Settings > Notifications and click Setup Notification.
Telegram (My Recommendation)
Telegram is my preferred notification channel for homelab alerts. It is free, reliable, works on every platform, and the bot API is simple.
- Open Telegram and search for @BotFather.
- Send
/newbotand follow the prompts. Give it a name like “Homelab Monitor”. - BotFather gives you an API token. Copy it.
- Create a new group or channel in Telegram for your alerts. Add your bot to it.
- Get the Chat ID. The easiest way: send a message in the group, then visit
https://api.telegram.org/bot<YOUR_TOKEN>/getUpdatesin your browser. Look for thechat.idvalue. - In Uptime Kuma, add a Telegram notification. Paste the Bot Token and Chat ID. Click Test.
Notification Type: Telegram
Bot Token: 123456789:ABCdefGHIjklMNOpqrsTUVwxyz
Chat ID: -1001234567890
You should get a test message in your Telegram group within seconds.
Discord (Alternative)
If your household or friend group already uses Discord, webhook notifications are even simpler:
- In your Discord server, go to Server Settings > Integrations > Webhooks.
- Create a new webhook. Pick the channel where alerts should land. Copy the webhook URL.
- In Uptime Kuma, add a Discord notification and paste the webhook URL. Click Test.
Notification Type: Discord
Webhook URL: https://discord.com/api/webhooks/1234567890/abcdef...
Pro tip: Set up at least two notification channels. If your email server is the thing that just went down, email notifications about it going down are not going to reach you. I use Telegram as primary and Discord as a backup. Belt and braces.
Once notifications are configured, go back to each monitor and assign the notification channel under the Notifications section of the monitor settings. You can also set a default notification for all new monitors in Settings.
Creating a Status Page
Uptime Kuma includes built-in status pages, similar to what you see on status.github.com or status.cloudflare.com, but for your homelab.
- Click Status Pages in the sidebar, then New Status Page.
- Give it a name and a slug (e.g.,
homelab). - Add groups like “Core Infrastructure”, “Applications”, “External Dependencies”.
- Drag your monitors into the appropriate groups.
- Customise the header, description, and footer if you want.
The status page is available at http://your-server-ip:3001/status/homelab. If you put Uptime Kuma behind a reverse proxy, you can make this a clean URL like status.yourdomain.com. If you do not have a domain yet, DuckDNS gives you a free subdomain with dynamic DNS that works well for this purpose.
I use mine as the default landing page on my homelab dashboard browser tab. One glance and I know if anything needs attention.
Advanced Monitoring
Docker Container Monitors
If you mounted the Docker socket during installation, you can add Docker Container monitors. These check whether a container is in a “running” state, which is different from checking if the service inside it is responding.
Use both together. A container can be “running” but have a stuck process inside. An HTTP endpoint can return 200 while the container is in a restart loop and you just caught it during the 3 seconds it was up. Both monitors together give proper coverage.
TCP Port Checks
Not every service has a web interface. For databases (PostgreSQL on 5432, Redis on 6379), MQTT brokers, SSH, or any service that listens on a port, TCP monitors confirm the port is open and accepting connections.
Monitor Type: TCP Port
Hostname: 192.168.1.50
Port: 5432
Heartbeat: 60s
DNS Resolution Checks
The DNS monitor type does not just check if your DNS server is reachable. It actually performs a DNS query and verifies the response. Point it at your local DNS server, resolve a domain you control, and check that the response matches what you expect. This catches configuration drift, not just outages.
Monitor Type: DNS
Hostname: pihole.local
DNS Server: 192.168.1.53
Port: 53
Record Type: A
Keyword Monitoring
HTTP monitors can check for specific keywords in the response body. This catches the scenario where a service returns a 200 status code but is actually showing an error page. Set a keyword that should always be present on the page, like the service name or a known heading.
Troubleshooting
Container Will Not Start
Check the logs:
docker logs uptime-kumaThe most common issue is port 3001 already in use. Check with ss -tlnp | grep 3001 and either stop the conflicting service or change Uptime Kuma’s port mapping in your compose file (e.g., "3002:3001").
Notifications Not Sending
Use the Test button on the notification setup page. If the test works but real alerts do not fire, check the monitor’s notification assignment. Each monitor needs to have the notification channel explicitly enabled under its settings. Setting up the notification globally does not automatically attach it to existing monitors.
False Positives (Flapping)
If you are getting alerts for services that are actually fine, increase the retry count to 3 or 5. A single failed health check can happen for all sorts of transient reasons, a busy host, a network blip, a garbage collection pause. You want to alert on sustained failures, not momentary hiccups.
Also check your heartbeat interval. Checking every 20 seconds is aggressive for a homelab. 60 seconds is the sweet spot for most services. Critical infrastructure like your proxy or DNS can go to 30 seconds if you want faster detection.
Warning: If you are monitoring external services (websites, APIs), be careful with very short intervals. Checking someone else’s site every 20 seconds from a residential IP can get you rate-limited or blocked. 300 seconds (5 minutes) is reasonable for external targets.
Data Growing Too Large
Uptime Kuma stores heartbeat data in SQLite. Over months, this can grow. In Settings > General, you can configure how long to retain detailed heartbeat data. I keep 180 days, which is enough to spot long-term trends without the database growing out of control.
You Are Monitoring Your Homelab. Here Is What Else You Should Be Running.
Uptime Kuma gives you visibility. But monitoring is one piece of a properly run homelab. Here is what to tackle next:
- Build Your First Homelab – if you are just getting started and landed here first, this is the foundation guide.
- Install Docker on Ubuntu – the prerequisite for running Uptime Kuma and most other self-hosted services.
- Self-Hosted Password Manager with Vaultwarden – another critical service worth monitoring. Runs as a single Docker container and keeps your passwords off third-party servers.
- Free Dynamic DNS with DuckDNS – access your Uptime Kuma status page remotely with a free subdomain, even on a dynamic IP.
- Nginx Proxy Manager – put Uptime Kuma behind a reverse proxy with a proper domain and SSL. Access your status page from anywhere.
- Uptime Kuma on Raspberry Pi 5 – running Uptime Kuma specifically on a Pi? That guide covers Pi-specific considerations and is part of our Pi 5 project series.
- Linux Commands That Get You Hired – the terminal skills you need to manage the host running all these containers.
Watch out for this: Set sensible alert intervals. I started with 1-minute checks and got bombarded with false positives from transient network blips. 5-minute intervals with a retry count of 3 gives you real alerts without the noise.
Key Takeaways
- Uptime Kuma is the fastest way to add monitoring to your homelab. Single container, five-minute setup, genuinely useful immediately.
- Start with your most critical services: reverse proxy, DNS, NAS, and two or three key applications. Do not try to monitor everything on day one.
- Set up at least two notification channels. If one goes down, you need a backup path for alerts.
- Use retries (3+) and sensible intervals (60 seconds) to avoid alert fatigue from false positives.
- Mount the Docker socket for container-level monitoring, but pair it with HTTP checks for full coverage.
- Status pages give you a single-glance overview and are worth the two minutes it takes to set one up.
- Monitoring is not optional, it is what separates running services from operating infrastructure. That distinction matters in your career too.
Related Guides
If you found this useful, these guides continue the journey:
- Grafana + Prometheus Monitoring — deeper metrics and dashboards beyond uptime checks
- Docker Compose for Beginners — manage Uptime Kuma alongside your other services
- Nginx Proxy Manager Setup — access your monitoring dashboard remotely
- Essential Docker Commands — troubleshoot container issues
- Build Your First Homelab in 2026 — the complete starting guide


ReadTheManual is run, written and curated by Eric Lonsdale.
Eric has over 20 years of professional experience in IT infrastructure, cloud architecture, and cybersecurity, but started with PCs long before that.
He built his first machine from parts bought off tables at the local college campus, hoping they worked. He learned on BBC Micros and Atari units in the early 90s, and has built almost every PC he’s used between 1995 and now.
From helpdesk to infrastructure architect, Eric has worked across enterprise datacentres, Azure environments, and security operations. He’s managed teams, trained engineers, and spent two decades solving the problems this site teaches you to solve.
ReadTheManual exists because Eric believes the best way to learn IT is to build things, break things, and actually read the manual. Every guide on this site runs on infrastructure he owns and maintains.
Enjoyed this guide?
New articles on Linux, homelab, cloud, and automation every 2 days. No spam, unsubscribe anytime.