Portainer on Raspberry Pi 5: See What Your Containers Are Actually Doing
There is a moment in every homelab journey where you realise you have lost track of what is running. You SSH in, type docker ps, and stare at a wall of truncated container names, port mappings, and status fields that tell you technically everything and practically nothing. Which container is eating all the RAM? What restarted overnight? Why is that one showing “unhealthy”?
I have been running containers in production for over two years. I have a newsletter platform on a Raspberry Pi 4 that sends real emails to real subscribers. I have monitoring, analytics, reverse proxies, Git servers — the lot. And I can tell you from experience: the command line is powerful, but it is not how you want to debug a failing service at 11pm on a Tuesday.
Portainer gives you a browser-based dashboard for your Docker environment. Containers, images, volumes, networks — everything visible and manageable from a single screen. But the real value is not the pretty interface. It is the shift in how you think about your infrastructure. You stop seeing “commands I ran once” and start seeing “resources I operate.”
Career Context: In enterprise environments, nobody manages containers by SSH-ing into servers and running docker ps. They use management platforms — Rancher, Lens, OpenShift, AWS ECS console, Azure Container Apps. Portainer teaches the same mental model: container lifecycle management through a control plane. Understanding this pattern — that infrastructure is observed and managed through dedicated tooling, not ad-hoc commands — is what separates someone who “uses Docker” from someone who “operates containerised infrastructure.” That distinction matters at £55-80k+ Platform Engineer and SRE roles.
Why You Need Visibility
After following the Docker guide, you have containers running. You can list them with docker ps. You can check logs with docker logs. You can inspect them with docker inspect. So why add another tool?
Because there is a difference between “I can find information if I know what to look for” and “I can see the state of my infrastructure at a glance.”
Consider these scenarios:
- A container has been restart-looping since 3am.
docker psshows it as “Up 2 minutes” — technically running, but you would not know it has restarted 47 times unless you checked the restart count. - Your Pi is sluggish. Which container is responsible?
docker statsgives you a live view, but you have to be looking at it at the right moment to catch a spike. - You deployed something last week and cannot remember what image tag you used.
docker inspectwill tell you, buried in 200 lines of JSON.
Portainer surfaces all of this immediately. Open the dashboard, and the state of your entire Docker environment is visible in seconds. Running, stopped, unhealthy, resource usage, image versions, network configurations — all of it.
This is not laziness. This is operational awareness. In enterprise environments, dashboards and control planes exist because humans are terrible at synthesising information from CLI output across multiple systems. A good dashboard does not replace the CLI. It tells you where to point the CLI.
Installation
Portainer runs as a Docker container itself. It connects to the Docker socket on your Pi and reads the state of everything running on it.
Following the directory structure from the Docker guide:
mkdir -p ~/docker/portainer/dataDocker Compose (Recommended)
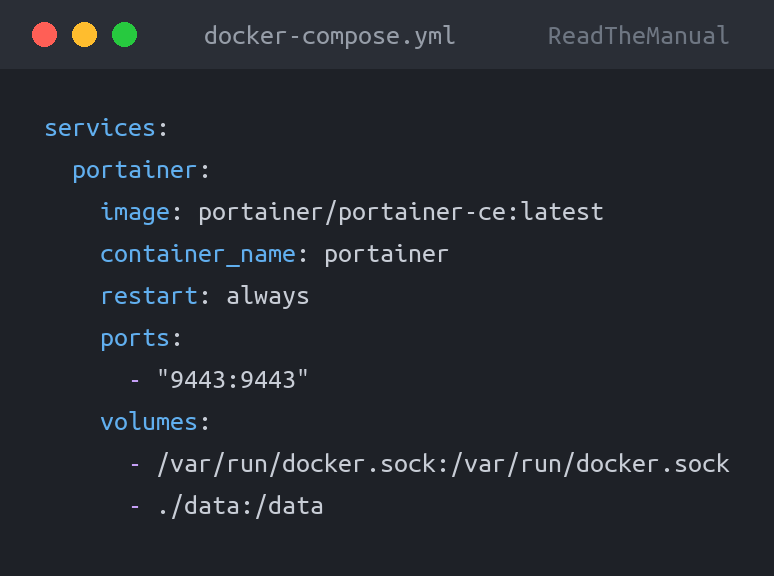
Create ~/docker/portainer/docker-compose.yml:
services:
  portainer:
    image: portainer/portainer-ce:latest
    container_name: portainer
    restart: always
    ports:
      - "9443:9443"
    volumes:
      - /var/run/docker.sock:/var/run/docker.sock
      - ./data:/data
Deploy it:
cd ~/docker/portainer
docker compose up -d
That is it. Portainer is now running on port 9443 with HTTPS.
The docker run Alternative
You will see this in official Portainer documentation:
docker run -d \
  -p 9443:9443 \
  --name portainer \
  --restart=always \
  -v /var/run/docker.sock:/var/run/docker.sock \
  -v portainer_data:/data \
  portainer/portainer-ce:latest
This works, but as discussed in the Docker guide, I strongly prefer Compose for anything that is not a throwaway test container. The Compose file documents your deployment. The docker run command lives only in your terminal history until it gets rotated out.
Why restart: always instead of unless-stopped? Portainer is your management interface. If you accidentally stop it, you want it to come back. For most services, unless-stopped is the right default — it respects your explicit decision to stop something. But for Portainer itself, always ensures you never lose access to your dashboard because of an accidental docker stop.
Why Port 9443?
Portainer 2.x uses HTTPS by default on port 9443 with a self-signed certificate. You will get a browser security warning the first time you connect — this is expected. Click through it (the exact method varies by browser). The connection is encrypted, just not with a certificate your browser trusts yet.
If you later set up Nginx Proxy Manager, you can put a proper Let’s Encrypt certificate in front of Portainer and access it via a clean URL without the warning. For now, the self-signed cert is fine.
Initial Setup and the Password Timeout Gotcha
Open https://your-pi-ip:9443 in your browser. You will see the initial setup screen asking you to create an admin account.
The five-minute timeout trap: If you do not create the admin account within approximately five minutes of Portainer starting for the first time, Portainer locks itself down for security reasons. You will see a message saying “Your Portainer instance timed out for security purposes.” The fix is to restart the container: docker restart portainer and immediately go to the setup page. Do not deploy Portainer and then go and make a cup of tea before setting it up. The clock is already ticking.
Create your admin account with a strong password. Portainer is a management interface with access to your entire Docker environment — treat the credentials accordingly.
After creating the account, Portainer asks you to connect to a Docker environment. Select “Get Started” for the local environment. Portainer detects the Docker socket you mounted and connects to it automatically.
You are now looking at the Portainer dashboard.
Dashboard Walkthrough: What to Pay Attention To
The Portainer dashboard can feel overwhelming at first. There are menus for containers, images, volumes, networks, events, and more. Here is what actually matters on a day-to-day basis.
The Home Screen
The home screen shows your environments. Since you are running a single Pi, you will have one local environment. The summary card shows:
- Running containers — How many are up
- Stopped containers — Anything that should be here but is not
- Healthy/Unhealthy — Containers with health checks that are failing
- Images — Total images stored locally
- Volumes — Number of Docker volumes
- Networks — Docker networks
The most useful number here is stopped containers. If you expect everything to be running and this number is not zero, something has gone wrong. That is your first troubleshooting signal every time you open the dashboard.
Container List
Click into your environment and then “Containers.” This is where you will spend most of your time. Each row shows:
- Name — Container name (this is why naming conventions matter)
- State — Running, stopped, or created
- Image — What image and tag the container is running
- Created — When the container was first created
- Published Ports — Which ports are exposed and where they map
- Ownership — Whether Portainer manages it or it was created externally
Click on any container name to see its detail page. This is where the real value lives.
Container Detail: The Stuff That Matters
Logs: Click the “Logs” icon (or navigate to the Logs tab). You get a scrollable, searchable log view. You can toggle auto-refresh, filter by keyword, and download logs. This is infinitely more useful than squinting at docker logs output in a terminal, especially when you are looking for a specific error in thousands of lines.
Stats: Real-time CPU and memory graphs for the individual container. When something is misbehaving, this is the first place to look. Is it a CPU spike? Memory leak? Network saturation?
Inspect: The full container configuration in a readable format. Environment variables, mount points, network settings, restart policy, resource limits. Everything you would get from docker inspect but actually readable.
Console: An in-browser terminal into the container. Equivalent to docker exec -it container-name /bin/sh. Useful for quick debugging without needing to SSH into the Pi first.
Operational habit: When you open Portainer, glance at the container list first. Check that everything you expect to be running is running. Check that nothing unexpected is stopped. Check the “created” dates — if a container was created recently but you did not deploy anything, it might have crash-looped and been recreated. This ten-second scan is the basis of operational awareness.
Container Logs: Your First Debugging Tool
I cannot overstate how much time Portainer’s log viewer saves. On the command line, checking logs means:
# Which container was it again?
docker ps
# Copy the name, paste it
docker logs --tail 100 some-container-name
# Scroll up, miss the relevant bit, try again
docker logs --tail 500 some-container-name | grep -i error
In Portainer, you click “Logs,” type “error” in the search box, and scroll. That is it.
More importantly, Portainer shows you the logs for stopped containers too. If a container crashed and Docker restarted it, the logs from the crashed instance are still there. On the command line, docker logs only shows logs for the current container instance. If it crashed and was recreated by a restart policy, those crash logs are gone.
Log retention note: Docker’s default logging driver keeps logs indefinitely, which can eat up disk space on a Pi. Consider adding log rotation to your containers. In your Compose file:
services:
  my-service:
    image: some-image:latest
    logging:
      driver: "json-file"
      options:
        max-size: "10m"
        max-file: "3"
This keeps a maximum of 30MB of logs per container. On a Pi with limited storage, this is sensible housekeeping.
Resource Monitoring: Knowing Before It Hurts
The Pi 5 with 8GB of RAM leaves roughly 6.5-7GB available for containers after the operating system and Docker overhead. That goes faster than you think.
Portainer’s container stats view shows real-time CPU and memory usage per container. But the more useful view is checking docker stats periodically to see the aggregate picture. Portainer shows you individual container metrics, which is perfect for diagnosis. But for a quick “is my Pi about to fall over?” check, the stats command gives you the full picture in one go.
What to watch for:
- Memory creep: A container that uses 200MB on day one and 600MB on day thirty likely has a memory leak. The Portainer stats view makes this visible over time.
- CPU spikes: Periodic is normal (a service processing a request). Sustained 100% is a problem.
- Restart counts: In the container list, containers that keep restarting will show short uptimes. “Up 2 minutes” on a container you deployed last week means something is crashing.
Volume Management
Portainer’s Volumes section shows all Docker volumes and bind mounts. The useful bit is seeing which volumes are “unused” — not attached to any running container. These accumulate over time as you experiment with different services.
You can remove unused volumes from the Portainer UI, but be careful — an “unused” volume might just belong to a container that is currently stopped. Check before deleting.
If you followed the bind mount approach from the Docker guide, most of your data is in the service directories rather than Docker volumes. This makes volume management simpler because there is less to manage.
The Shift: From Running Containers to Operating Infrastructure
This is the conceptual turning point that Portainer facilitates, and it is worth dwelling on because it is the difference between a hobbyist and an operator.
Before Portainer: You deploy a container. It runs. You forget about it. Occasionally you SSH in and poke around. If something breaks, you notice when the service is not available — which might be hours or days later.
After Portainer: You deploy a container. You check its health in the dashboard. You notice when resource patterns change. You see restart events. You know what version of what image is running where. You have a mental model of your infrastructure state that is current, not historical.
This is what enterprise operations looks like. SRE teams do not SSH into servers to check if things are running. They have dashboards, control planes, and alerting. The specific tool does not matter — Portainer, Rancher, Lens, the AWS ECS console, the Azure portal. The pattern is the same: observe your infrastructure through a management layer, not through ad-hoc CLI sessions.
When you build this habit on a Pi running six containers, you are building the same operational instincts that scale to six hundred containers in an enterprise. The muscle memory is transferable.
Stacks vs Standalone Containers
Portainer has a feature called “Stacks” which is essentially Docker Compose through the web UI. You paste a Compose file into Portainer, and it deploys and manages the containers as a group.
How Stacks Work
In Portainer, go to “Stacks” and click “Add Stack.” You can paste a Docker Compose file directly, pull one from a Git repository, or upload a file. Portainer then deploys it and tracks the containers as a grouped unit.
This is convenient for several reasons:
- You can see which containers belong to which service at a glance
- You can stop, start, and update an entire stack together
- Environment variables can be managed through the Portainer UI
- You can pull stack definitions from a Git repository for version control
Stacks vs CLI Compose: The Honest Assessment
I use both, and here is my honest take on when each makes sense:
Use Portainer Stacks when:
- You are managing a small number of services and want everything in one interface
- You want to pull Compose files from a Git repository (useful for a centralised config repo)
- You want non-technical users to be able to restart services without SSH access
- You are evaluating a new service and want to deploy it quickly from the browser
Use CLI Compose when:
- You are scripting deployments or updates (Ansible, bash scripts, CI/CD)
- You need to test Compose file changes before deploying (syntax checking, dry runs)
- You are managing multiple hosts and want a consistent workflow across all of them
- You are working alongside automation tools that expect files on the filesystem
- You want your deployment workflow to work even if Portainer is down
The Portainer lock-in concern: If you deploy everything through Portainer Stacks and Portainer goes down, you cannot easily redeploy or update your services until Portainer is back. If your Compose files are on the filesystem, you can always docker compose up -d from the command line. My approach: deploy from the CLI using Compose files on disk, and use Portainer for monitoring, logs, and quick actions. Best of both worlds.
Containers deployed from the CLI appear in Portainer automatically. You do not have to choose one or the other. Portainer sees everything running on the Docker daemon, regardless of how it was deployed. Deploy with CLI Compose, manage and monitor with Portainer. This is my recommended workflow.
When Portainer Helps vs When CLI Is Better
Portainer is not a replacement for the Docker CLI. It is a complement. Knowing when to use each is an operational skill in itself.
Portainer Wins
- Quick health check: “Is everything running?” is answered by opening a browser tab. From the CLI, it requires SSH,
docker ps, and mentally parsing the output. - Log searching: The search-in-browser experience beats
grepondocker logsoutput, especially for large log volumes. - Showing others: Explaining your infrastructure to someone is much easier with a dashboard than with terminal output. This matters for blog posts, job interviews, and convincing your partner that the Pi under the desk is actually doing something useful.
- Quick container actions: Restarting a container, pulling a new image, removing old containers — point and click is faster when you are already in the browser.
- Container inspection: Viewing environment variables, mount points, and network configuration is more readable in Portainer than in
docker inspectJSON output.
CLI Wins
- Batch operations: Stopping all containers, pruning images, or rebuilding multiple services is faster and more scriptable from the CLI.
- Compose file management: Editing a Compose file, validating it, and deploying it is more natural on the command line with your text editor of choice.
- Automation: Anything you want to run on a schedule, trigger from a script, or integrate into a CI/CD pipeline needs the CLI. Portainer has an API, but the CLI is simpler for homelab use.
- When Portainer itself is the problem: If Portainer is crashing, you need the CLI to diagnose and fix it. Never rely solely on a tool for managing the infrastructure that runs the tool.
- Building and pushing images: Docker build workflows are inherently CLI-driven.
The practical balance: Use the CLI for deploying and updating services (Compose files, version control, reproducibility). Use Portainer for monitoring, debugging, and quick operational tasks (logs, stats, restarts). You will naturally find your own balance — the point is to be comfortable with both.
Portainer Community Edition vs Business Edition
Portainer offers a free Community Edition (CE) and a paid Business Edition (BE). For a homelab, CE is all you need. The business features — RBAC (role-based access control), OAuth integration, external registries management, activity logging — are enterprise features you do not need on a personal Pi.
BE does offer a free licence for up to five nodes, which could be useful if you expand to a multi-Pi cluster. But start with CE. You can always switch later without losing your configuration.
Keeping Portainer Updated
Portainer updates regularly. Since it is just a container, updating is straightforward:
cd ~/docker/portainer
docker compose pull
docker compose up -d
Portainer stores its configuration and state in the ./data directory. As long as that persists (and it will, because it is a bind mount), updates preserve your settings, users, and environment configurations.
Check the release notes before major version updates. Portainer occasionally makes breaking changes between major versions. A quick look at the release notes on their GitHub releases page takes 30 seconds and can save you from unexpected issues. For minor updates (2.21.4 to 2.21.5), you are generally safe to pull and deploy.
Practical Tips From Running Portainer in Production
A few things I have learned from running Portainer across multiple hosts over the past two years:
Bookmark the URL. This sounds trivial, but Portainer is only useful if you actually open it. Put it on your browser’s bookmark bar or home screen. The ten-second daily health check only happens if access is frictionless.
Name your containers consistently. Portainer displays whatever name Docker assigns, which is the container_name from your Compose file or an auto-generated hash. Always set explicit names. portainer, pihole, nginx-proxy-manager — descriptive, lowercase, hyphenated. When you have 15 containers in the list, names like uptime-kuma are much more useful than docker-uptime-kuma-uptime-kuma-1.
Use labels for organisation. Docker labels are key-value metadata you can add to containers. Portainer displays them and can filter by them. Consider adding labels like project=pi5-homelab or category=monitoring to your Compose files for better organisation as your stack grows.
services:
  uptime-kuma:
    image: louislam/uptime-kuma:1
    container_name: uptime-kuma
    labels:
      - "project=pi5-homelab"
      - "category=monitoring"
Check the “Events” section periodically. Portainer logs Docker events — container starts, stops, health check failures, image pulls. When something has gone wrong and you are not sure when it started, the events timeline gives you a chronological view of what happened.
Career Value: What You Have Actually Learned
Installing Portainer takes five minutes. The career value is in what it teaches you to do and think about after installation.
| What You Did | Enterprise Translation |
|---|---|
| Deployed a management UI for containers | Container management platforms (Rancher, Lens, OpenShift Console) |
| Monitored resource usage through a dashboard | Observability and capacity planning |
| Managed container lifecycles through a control plane | Platform engineering, infrastructure operations |
| Debugged issues using centralised logs | Log aggregation and incident response |
| Compared Stacks vs CLI workflows | GitOps vs UI-driven deployment trade-offs |
| Established operational habits (daily health checks) | SRE practices, operational awareness, runbook culture |
Interview Talking Points
- “How do you monitor your containerised services?” — “I use Portainer for real-time container health, resource metrics, and log access. For broader infrastructure monitoring, I also run Uptime Kuma for endpoint availability.” (See Project 7.)
- “Tell me about a time you debugged a container issue.” — Talk about noticing a restart loop in Portainer, checking the logs through the UI, finding the error, and fixing the configuration. This is a real operational scenario, not a hypothetical.
- “What’s the difference between running containers and operating them?” — Running is
docker run. Operating is knowing what is running, how it is performing, when it last restarted, and what to do when it misbehaves. Portainer is the bridge between those two states.
Nobody gets hired for installing Portainer. People get hired for demonstrating operational thinking — the awareness that infrastructure needs to be observed, managed, and maintained, not just deployed and forgotten. Portainer is the tool that builds that instinct.

Next Steps
- Project 3: Pi-hole — Network-wide ad blocking and your first real DNS infrastructure experience
- Project 7: Uptime Kuma — External monitoring that alerts you when things break (complements Portainer’s container-level view)
- Back to Project 1: Docker — If you skipped the directory structure and Compose fundamentals
- Back to the Pi 5 Series Hub — See all 10 projects and the recommended order
Already running Portainer? What patterns have you noticed in your container resource usage? Drop a comment — I am always interested in how other people’s homelab stacks are performing.

ReadTheManual is run, written and curated by Eric Lonsdale.
Eric has over 20 years of professional experience in IT infrastructure, cloud architecture, and cybersecurity, but started with PCs long before that.
He built his first machine from parts bought off tables at the local college campus, hoping they worked. He learned on BBC Micros and Atari units in the early 90s, and has built almost every PC he’s used between 1995 and now.
From helpdesk to infrastructure architect, Eric has worked across enterprise datacentres, Azure environments, and security operations. He’s managed teams, trained engineers, and spent two decades solving the problems this site teaches you to solve.
ReadTheManual exists because Eric believes the best way to learn IT is to build things, break things, and actually read the manual. Every guide on this site runs on infrastructure he owns and maintains.
Enjoyed this guide?
New articles on Linux, homelab, cloud, and automation every 2 days. No spam, unsubscribe anytime.